SellerBoard
Is this Tool Worth The Money?
This is my complete SellerBoard Guide.
In this new Guide you will learn everything there is to know about this Reporting and Accounting Management Tool, including:
- Key Features
- Real-life use Cases
- Advanced Tips
- How SellerBoard compares to similar Reporting Tools like Fetcher.
- Lots More
So if you want to get the most out of SellerBoard, this the guide for you.
Let’s Get Started.

Contents
Chapter 1:
Intro to SellerBoard
What is SellerBoard?
At it’s Core, SellerBoard is a Sales and Profit Analytics Tools for Amazon Sellers.
But it goes much Deeper than that, they also offer:
- Inventory Management
- PPC Optimization
- Autoresponder
- Refunds for Lost Inventory
- and more

What is SellerBoard used for?
SellerBoard is mainly used for Accounting, Reports, Keeping Track of Sales and most Importantly Profits.
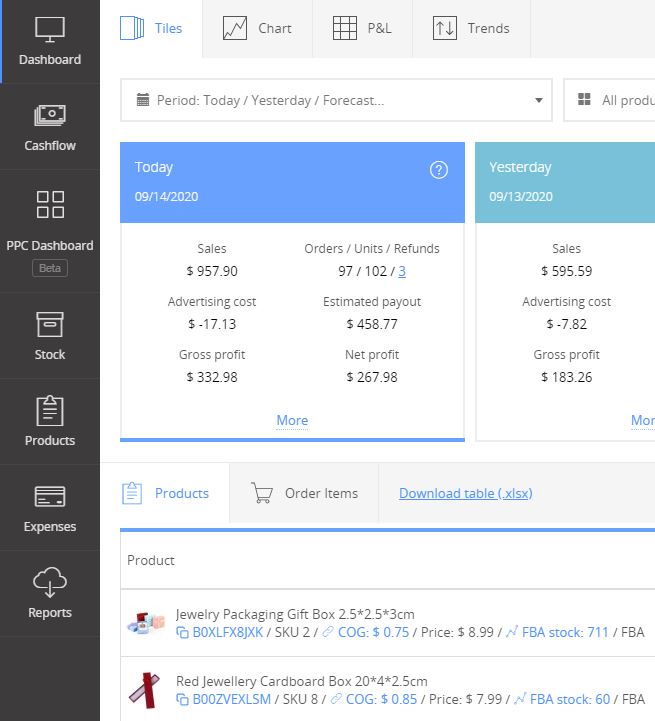
From their Dashboard, you can view your data at the Account Level and Item by Item. I cannot stress enough how important this is to know. We had 2 Products eating into our profits and we didn’t even realize it before using SellerBoard.
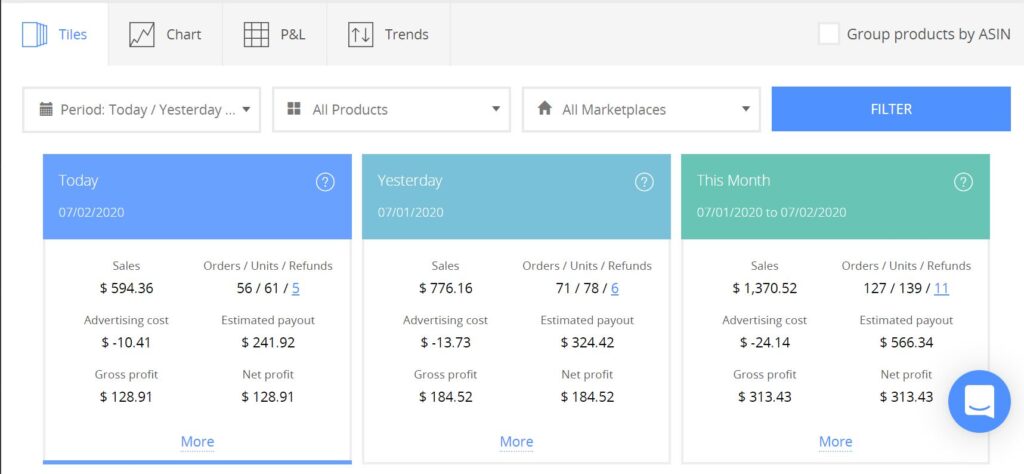
I have to say, this Dashboard looks really nice, and it has everything we need at a glance. It updates real-time, and I found it to be very accurate.
By Default you see the entire account information with 5 Tiles for:
- Today
- Yesterday
- This Month
- This Entire Month (Foretasted)
- and Last Month.
Each of these Tiles contains the Sales, Units, Profits and more.
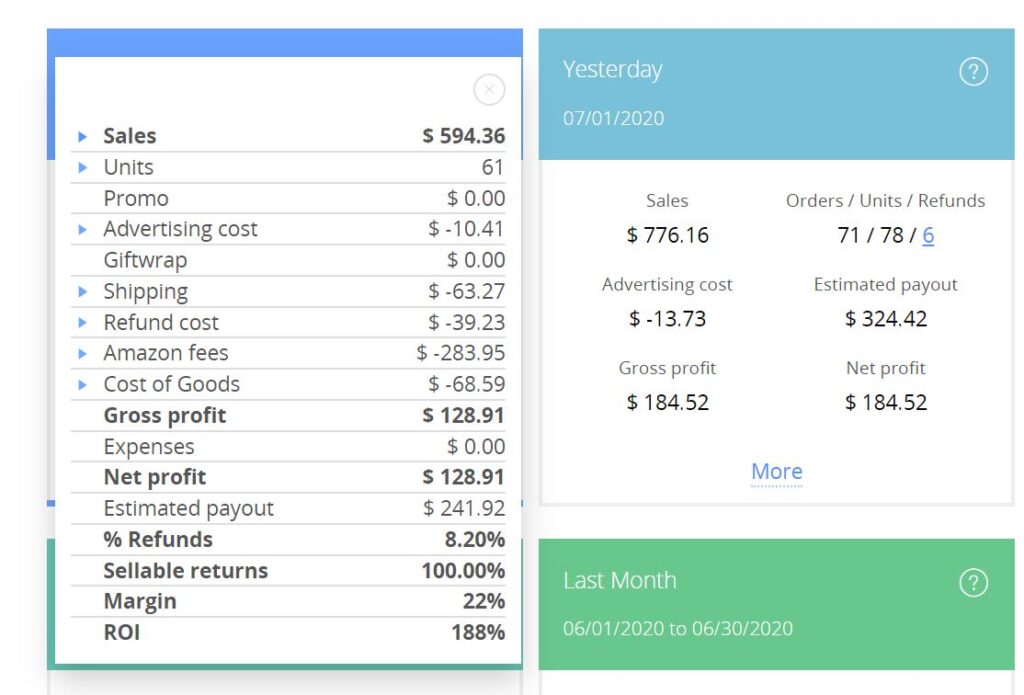
The More Button contains a lot of additional, detailed, information such as :
- Amazon Fees
- Cost of Goods
- Margins
- and ROI
The Margins and ROI (Return on Investment) are often overlooked by many sellers, but I think that is a mistake.
Most seller don’t look at margins percentage at all, or just estimate it in the beginning and then don’t monitor it.
This is a Big Mistake!
Estimated Margins will be different than Real Margins because of Price Changes, Adventuring Costs, Shipping Costs and more. So it’s very important that Margins are monitored Weekly or, at most, Monthly. I had 2 products that became less profitable and I decided to dropped them, leaving me more time and money to focus on my highly profitable Products.
PRO TIP: Monitor your Margins and ROI!
Healthy Margins should be over 30%, and your ROI should be 100% or more.
Ways to improve your Margins:
- Increase the price slightly. You may want to sell for as cheap as possible hoping to get many sales, DON’T! If your margins are too low, increase your price by $0.50 per week until your reach 30% or more. If the product does not sell anymore at that price, drop it and find something else.
- Optimize your PPC Advertising. You may be heavenly investing in PPC to get sales, but that eats up you profits. Or you may not use it at all, which is even worst! I could write an entire blog on PPC Campaign, so i’ll try to TLDR it: Create an Automatic Campaign and run it for a few dollars per day ($5-$10). In a few days, this will generate a keyword report, so you can figure out what people are searching for and what keywords convert the best. Then, take the keywords that convert the best and add them to a manual camping and optimize the bids little by little.
Dashboard Filters
But what if you are interested in a different time-frame, or want to see the the information for a specific product or marketplace?
That where you use the Dashboard Filters:
- Date Range
- Products
- Marketplace
There are 7 Pre-Defined Date Ranges, as well as a Custom Range, which will allow you to select what ever you like.
As far as Products and Marketplaces, there are selectable toggles that allow you to view one or multiple at a time.


How Much does SellerBorad Cost?
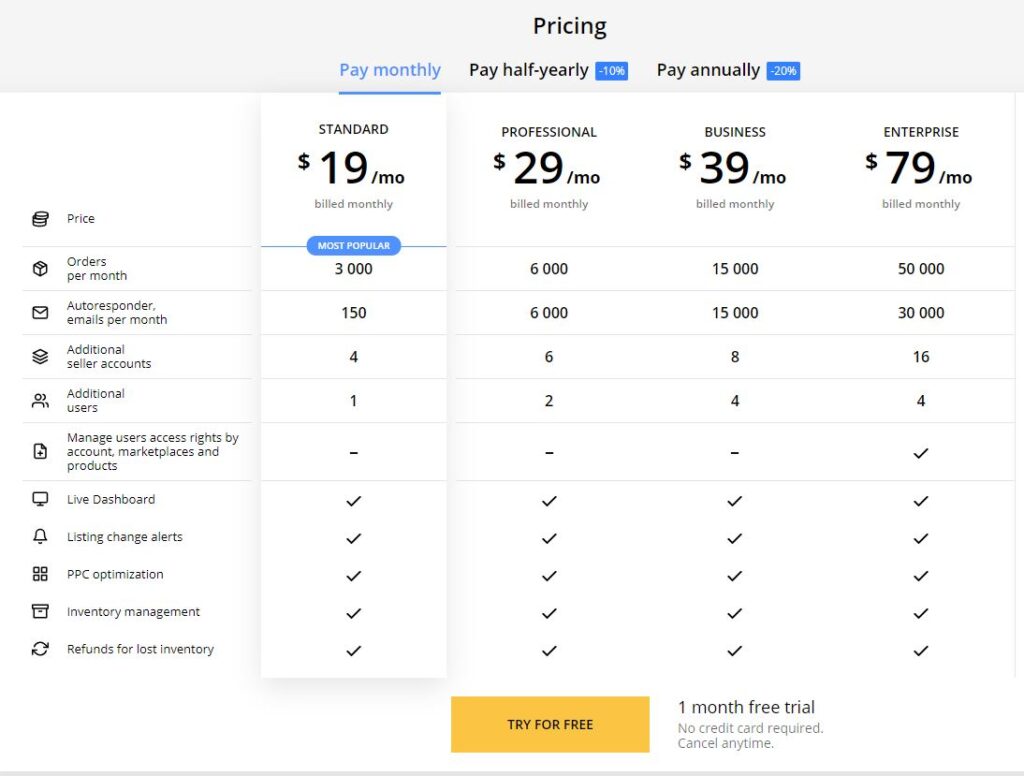
Pricing Depends mainly on the number of Orders per month.
The starting price is $19 per month, which is on par, or cheaper than most other offerings. You can get a better deal if you pay yearly.
There is a free trial as well, Seller Board offers 2 Moths Free for our Website Members, more info here, which is double, compared to their standard 1 Month to everyone else.
Chapter 2:
SellerBoard Terms And Metrics
If you use SellerBoard for more than 30 seconds, you will notice that the tool contains A LOT of different terms and metrics.
(Like “COG”, FBA Stock”, “PPC” and “ROI”)
I know these terms are a combination of Amazon Terminology, Accounting and Business.
So before we take a deeper look at Seller Board, it’s important to learn to “speak SellerBoard”.
I’ll also translate any of the technical stuff into easy-to-understand terms.
Common SellerBoard Terms
Here’s a breakdown of the terms that you’ll run into as you use SellerBoard.
PPC – Pay Per Click. This term is used by most adverting Software like Google, Facebook and Amazon to indicate an advertising strategy where you bid a dollar amount for certain search terms the customers use to shop on the platform. For Example: when someone searches for “kids toys”, the first 2 results are going to be advertisements for the sellers that bid the most for this term.
HSA – Headline Search Ads. This is another type of Advertisement that appears as a banner at the top of the Amazon Page. This type of Ad can be used only by Brands that have a Trademark Registered.
FBA – Fulfillment by Amazon. This is a business model where the Seller Sends their Stock to Amazon for Storage, Fulfillment and Customer Service. Amazon, in term keeps 15% plus a “Fulfillment Fee”.
FBM – Fulfillment by Merchant. In this Business Model, the Seller stores and Ships their Product Directly to the Customer.
COG – Cost of Goods Sold. This term refers to the total Unit Manufacturing Cost and is used to calculate profits.
ROI – Return on Investment. is a performance measure used to evaluate the efficiency of an investment by measuring the amount of return, relative to the investment’s cost.
Amazon SKU -Stock Keeping Unit. A unique alphanumeric code used to track a product for inventory and sales purposes. This only shows in the back-end system.
Amazon FNSKU – Fulfillment Network Stock Keeping Unit. This is also a code, and it’s the way that Amazon identifies a product as unique to the seller that has sent it to the Amazon fulfillment center. This the bar-code that appears on the Amazon Labels.
Amazon ASIN – Amazon Standard Identification Number. This is a 10-character alphanumeric unique identifier that’s assigned by Amazon.com and its partners. It’s primarily used for product-identification within their product catalog.
With that out of the way, let’s get into the features.
Chapter 3:
SellerBoard Features
SellerBoard has a surprisingly large number of Features.
It’s Bread and Butter is of Course The Live Dashboard, but it also has:
- Configurable Charts
- Profit and Loss Forms
- Trends Tracking
- Cash-flow Analysis
- and More.
Lets take a look at all these.
Live Dashboard
Displays detailed information on Amazon fees (e.g. FBA fee, commissions), PPC spend, return costs, promotion costs, and your fixed costs (e.g. Virtual Assistant, Prep Center). You can also view by time period (today, yesterday, or this month) and by product.
Configurable Charts
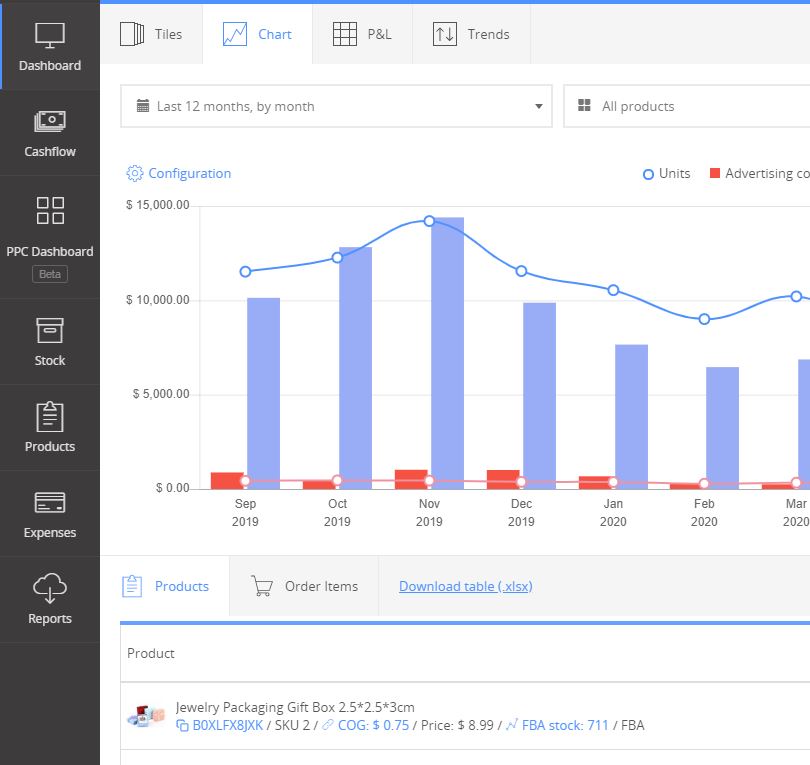
Flexible charts enable quick and convenient analysis of your Key Performance Indicators. Everything is customizable: KPI’s (e.g., sales, units, profit, return costs, etc.), time frame and granularity of the output (e.g., last year by month, last month by day). The view can be filtered by marketplace or product (with multi-selection).
Profit and Loss View
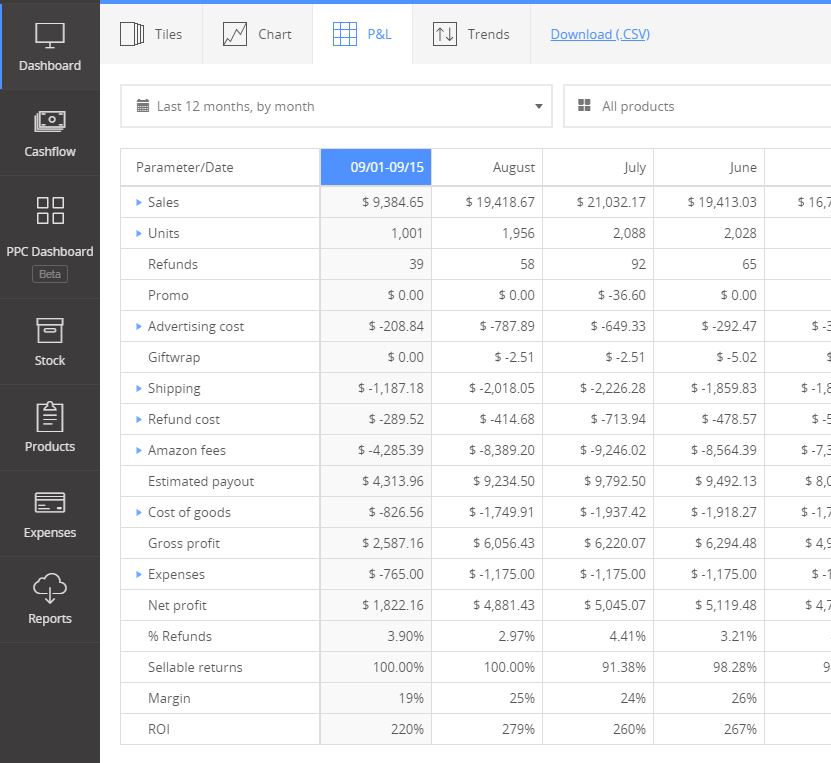
This is a smart, clickable P&L statement, with the ability to focus on every parameter (e.g., amazon fees) of each time period. You can customize the time frame and granularity of the data (e.g., last year by month, last month by day), filter by marketplaces or products and view products sold in any selected period.
Trends
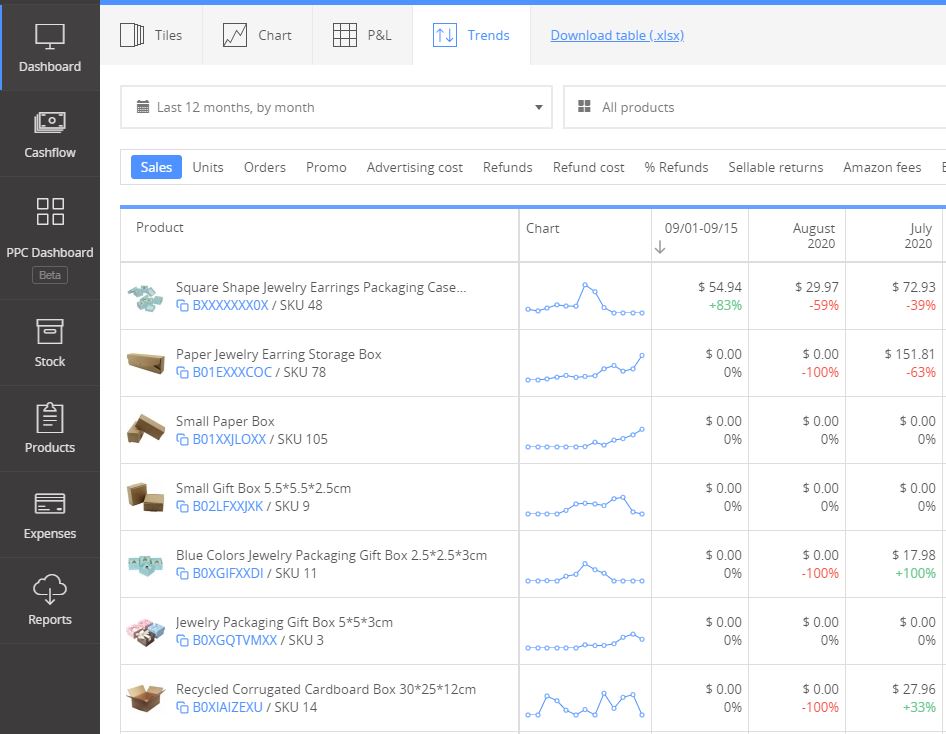
The trends feature in SellerBoard helps you keep track of all important KPI’s for every product to make sure you don’t have a negative trend. Such KPI’s are for example BSR, sales, returns, profit. If you any of them on a down-trend, you should take action (e.g. decrease price, check the quality, run ads, etc).
You can select a KPI (e.g. return rate) and a time frame and see a table with all your products and their month by month performance.
Cashflow
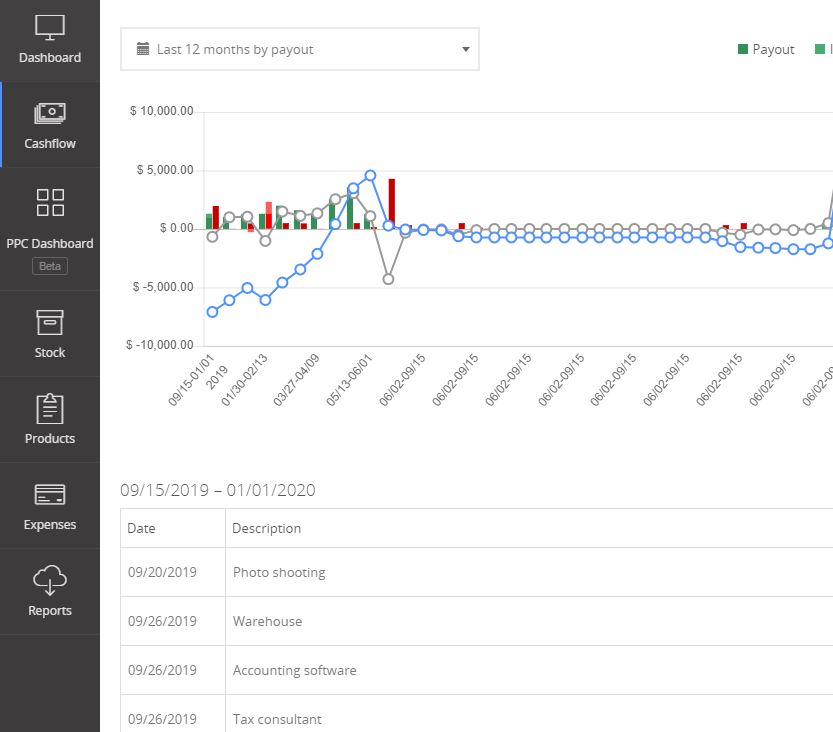
The Cashflow tool allows you to manage your cash flow, by clicking the “add” button to fill in the amount of additional investment in the business, the amount paid for the goods, as well as dividends and VAT. Payments and Expenses are filled automatically. The forecast will help you plan the amount of available cash and make the right management decisions.
PPC Optimization
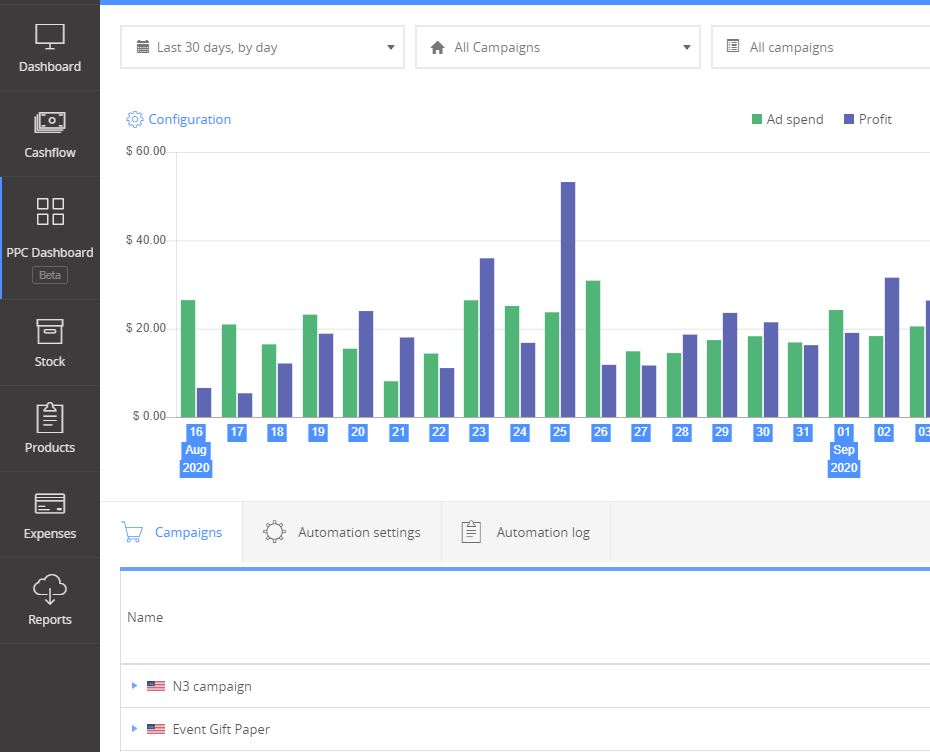
The PPC dashboard tracks the profitability of your PPC campaigns, ad groups and keywords and helps you optimize bids to reach your target profitability.
SellerBoard Uses an unique algorithm, which estimates profit by PPC campaign. Based on this estimated profit, SellerBoard calculates the Break-even-ACOS and the Break-even-bid for every keyword and makes recommendations on how to optimize your bids.
Product Breakdown
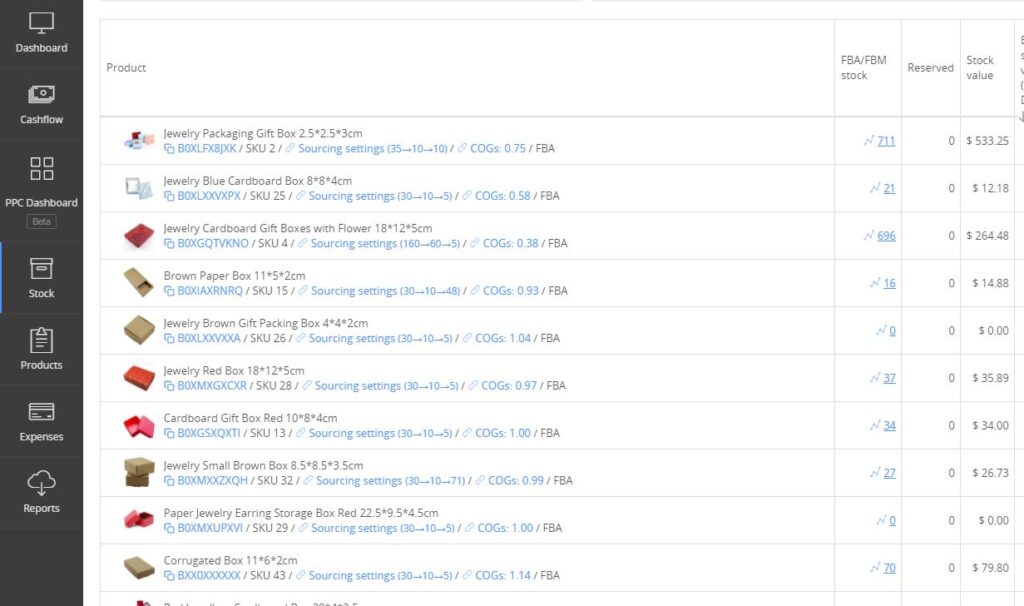
You can see exact details on any product, and for any period or marketplace.
See actual sales, profit, fees and expenses related to each product; e.g., COGS, cost of returns, PPC, VAT tax, by any period.
Mobile App
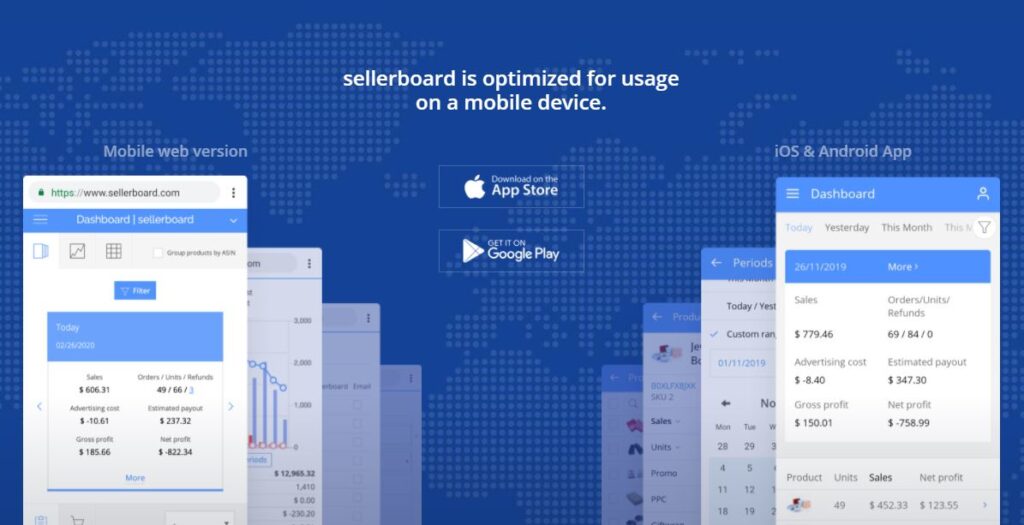
Seller Board has a Mobile App for Android and iOS!
I’m not sure why more software providers don’t do this, but having a mobile app is Amazing!
If you would like to learn more about SellerBoard, visit their Website HERE.
If you would like to learn more about Selling on Amazon, I create the Amazon Business Mastery Course where you can learn how to build your Amazon FBA Business Step-by-Step and put SellerBoard to good use.
Also check out Helium 10 vs Jungle Scout.
Conclusion
I Hope you enjoined my Guide to SellerBoard.
Now i’d like to hear from you:
Do you already use SellerBoard?
If so, what’s your favorite feature?
Let me know by leaving a comment below right now.








3 thoughts on “SellerBoard Guide for 2024: Is this Tool Worth the Money?”
Very Informative!!
Hey, the content is awesome and its very informative for. Keep the good work
Thank you!